Contents
3.2. Database query options
3.3. Search by Pollutant
3.4. Search by Habitat/Species
3.5. Search by Issue
3.6. Search by Location
3.7. Biomonitoring
3.8. Help/General Information on Atmospheric Pollution (Glossary, Unit Conversions, Comments page)
1. Aims of the Air Pollution Information System
The UK Air Pollution Information System (APIS) is a web database that incorporates available research on air pollution and its environmental impacts. It is particularly relevant for both pollution specialists dealing with conservation threats, as well as conservation specialists dealing with pollutant issues. The database allows users to search for information on particular air pollution issues (e.g. acidification, euthrophication), pollutants (e.g. SO2, NOx), habitats (e.g. Native Pine Woodland and Acid Grassland) and species/species groups (e.g. Scots Pine, Brown Trout, Mosses and Liverworts). In addition, the system provides quick access to overviews on the pollutants, receptors and impacts, as well as a glossary and relevant literature.
2. General Information about the Database
2.1. Outline of the database structure
The relational database is based on a collection of around 40 tables, which together provide all the information needed for the database query system. Data retrieval is facilitated by a number of forms built around the database tables.
2.2. Pollutants covered by the database
The primary focus of the database is on pollutants which have a direct impact on habitats and species, or impact through their deposition in the UK. These include regional tropospheric pollutants such as sulphur dioxide (SO2), nitrogen oxides (NOx), ammonia (NH3), ozone (O3), acid deposition and nitrogen deposition. Further developments have included Halogens, Heavy Metals, VOCs, POPs and Dusts.
In addition, the overview sections also cover summary information regarding a range of other air pollution issues, including halogens, aerosols, greenhouse gases (carbon dioxide (CO2), methane (CH4), nitrous oxide (N2O), chlorofluoro-carbons (CFCs)), and radioactivity.
2.3. Habitat and species selection criteria
Habitats, plant and animal species and species groups were selected for inclusion into the database on one or more of the following criteria:
-
conservation value (see Habitats Directive and BAP lists)
-
high sensitivity to air pollution impacts (e.g. lichens as important indicators for acidification)
-
well-known species / species groups which may not be protected under the HD or BAP, but have a high profile in the public opinion
Similar species with similar key concerns, which do not merit separate inclusion into the database, have been summarised into species groups and sub groups (i.e. mycorrhizal fungi), and any air pollution concerns are described for those groups together with mention of some key species in the "key concerns" or "additional information" fields in the database entry form.
This approach also allows the inclusion of all types of plants and animals in some category, even if they are not mentioned by name. For instance, the species list contains general records for e.g. fungi (general), bryophytes (general), stoneworts (general), ferns (general), in addition to specialised records for single species. Other benefits of this summary approach are: keeping the database from growing excessively large and repeating information over and over; as well as a lack of literature for many species.
3. How does the database work?
The APIS is designed to be user-friendly and should be more or less self-explanatory, however, detailed instructions are provided below.
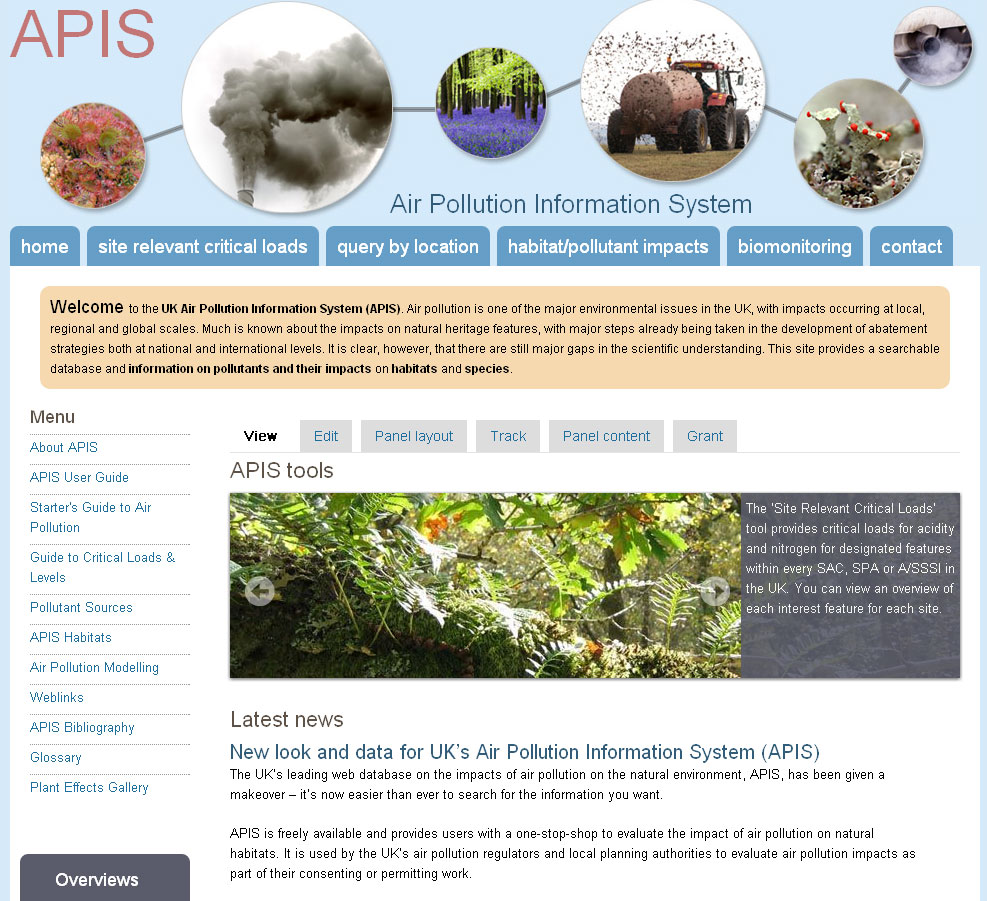
Start from the APIS home page, (Figure 1, see below).
This menu provides access to overview sections, the main database query options, and further helpful information such as a glossary and unit conversion tables.
These sections summarise general information on:
-
Pollutants (i.e. for each pollutant: main sources, main impacts)
-
Legislation and agreements (i.e. short descriptions of national and international air pollution regulations/legislation)
-
Impacts by issue (i.e. for each issue (such as acidification, eutrophication, climate change etc.): pollutant sources, effects and main)
-
Impacts by ecosystem (i.e. main air pollution issues for selected ecosystems (such as woodland, freshwater), including the pollutants involved, sources, and effects)
Overview documents provide textual information (with suggestions for further reading, www links, maps, pictures and tables where available/appropriate) in HTML format. They can also be printed.Most overview documents contain links, which allow you to access other related overview sections (These links are easily recognisable as they are blue underlined text).
To access the overview sections, select a pollutant, regulation, issue or receptor from the scrollable pull-down menus (click on the down-arrow to display the scroll list - see Figure 2).

Figure 2 - The homepage screen - Selecting an overview section
3.2. Database Query Options
The application provides different approaches for querying the database:
-
Search by Habitat/Species/Ecosystem Pollutant Impacts: Users may want to look up impacts of a particular pollutant on one or more habitat(s) and/or species, e.g. to check which plants or habitat in a protected area may be particularly susceptible to a pollutant emitted from a proposed development. For explanations on how to query the database for a habitat/species pollutant, see Section 3.3. below.
-
Search by Location: This tool interrogates national datasets on air pollution exposure and receptor sensitivity to estimate the approximate extent to which critical loads or critical levels are exceeded. It should be noted that the national datasets used are often highly uncertain at the level of individual sites, and these uncertainties need to be carefully considered in interpreting results. This simple site-based assessment is designed to give a first indication of whether or not the issue identified is an important air pollution concern at the location specified.
- Search Biomonitoring Methods: APIS provides information on biomonitoring methods that can be used for assessing the impacts of air pollution on ecosystems. Users can search for suitable biomonitoring methods by selecting a pollutant and an ecosystem. Each resulting record gives a description of the method, its suitability to indicate atmospheric concentrations, depositions or impacts, the timescales required and any limitations, the level of expertise needed in the field or lab, plus an indication of cost. It also provides a number of references for further reading.
3.3. Database Habitat/Species/Ecosystem Pollutant Impacts
Select "Habitat/Pollutant Impacts" on the home page (Figure 1). This will open the following page (Figure 3)
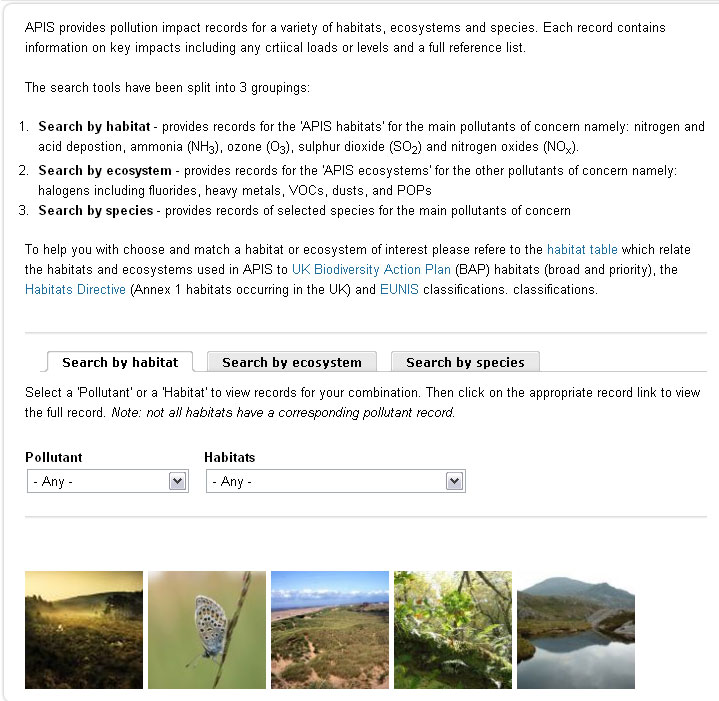
Figure 3 - The "Search by pollutants" window
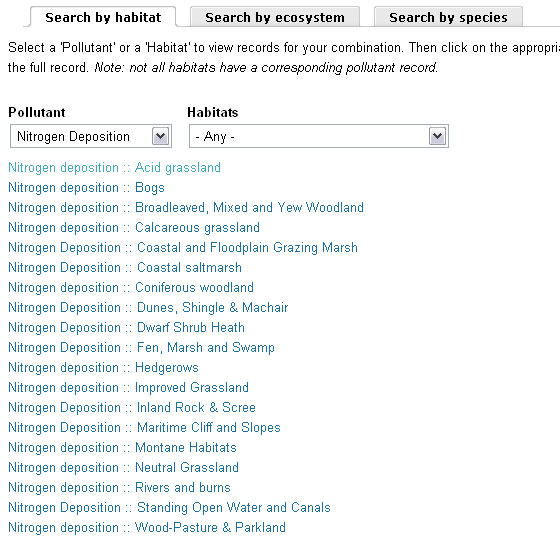
Search by Habitat allows a user to select a pollutant (Figure 4) . The following set of pollutant habitat records will be shown as hyperlinks to the full record. Similarily a habitat can be selected instead to give a range of pollutants which have records for that habitat. View 'Any' to see the full list of records. For species, you can select by a species group as well as a pollutant. Ecosystem records are for other pollutants of concern including Heavy Metals, POPs and Halogens.
Figure 4 - Search by Habitat
Quite often the habitat of interest will not be obvious from the list of APIS habitats seen in Figure 4. To guide the user into deciding which habitat to choose the Habitats Table provides information on how APIS habitats have been classified in comparison to Habitats Directive Annex 1 habitats, BAP habitats and EUNIS habitats (Figure 5).
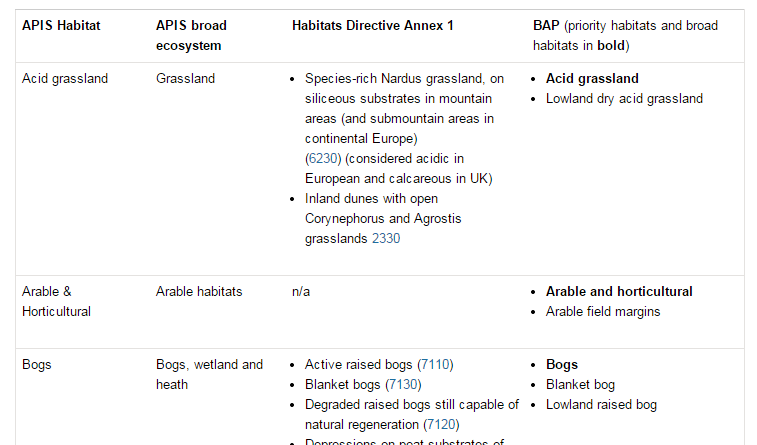
Figure 5 - Habitats Table
Example: If you selected "Ammonia" and "Dwarf Shrub Heath", the result appears as follows (Figure 6):
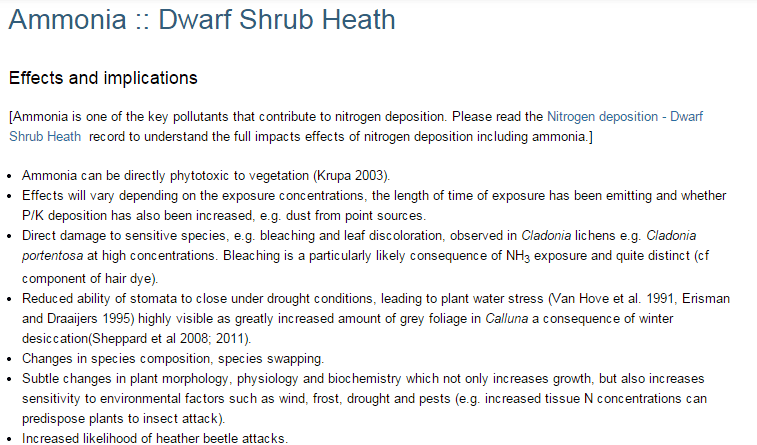
Figure 6 - The Search By Pollutant results page
Explanation of Results:
-
Effects and implications - describes the key effects
Overview: evidence, processes and main impacts - is the main text for the entry giving full detail and refernces of the impacts.
Pollutant deposition type and risk areas - provides information on the areas at riks from this pollutant
Indicators - indicators of the pollutant effects are provided
Examples of species specific responses - any examples of specific species response are given with relevant references
Critical Load/Critical Level field:
-
- If the database record is about effects of direct exposure to an atmospheric pollutant, only the "critical level is available, whereas a "critical load" is only available with deposition effects of a pollutant. Thus the non-relevant critical threshold field in either case is "not applicable".
-
- "no estimate available" indicates that insufficient or no research has been done to provide an estimate of a critical load or level for the selected habitat/species.
-
-
The Critical Load/Level Detail shows:
-
- the ecosystem(s), habitat(s) or species, for which the critical load/level applies
-
- the critical load/level value (including the units)
-
- a brief description of the effects of the critical load/level being exceeded, or other relevant comments specific to this critical load/level value (NB: Any longer descriptions can be found in the Key Concerns.)
-
- an estimate of the certainty of Critical Load/Level, which best describes the critical load/level value (e.g. "insufficient data", "expert judgement", "reliable").
-
- a reference which quotes the critical load/level value above.
Select "Search by Location" from the main menu on the home page (Figure 1) to open the following window
(Figure 10).
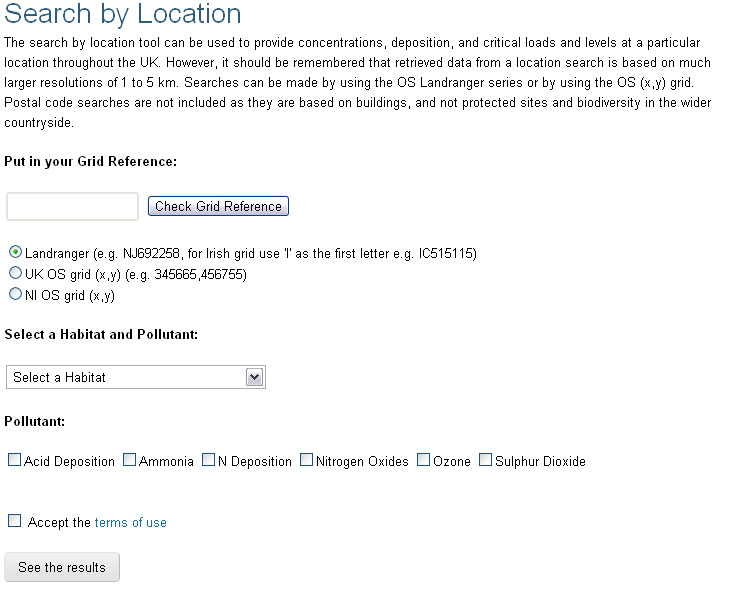
Figure 10- The "Search by Location" window.
Put in the full grid reference into the text boxes (e.g. NT359589) and select a habitat (e.g. Beech woodland) and one or more pollutants (e.g. N Deposition). Click 'See the results' to display the results, Figure 11 below.
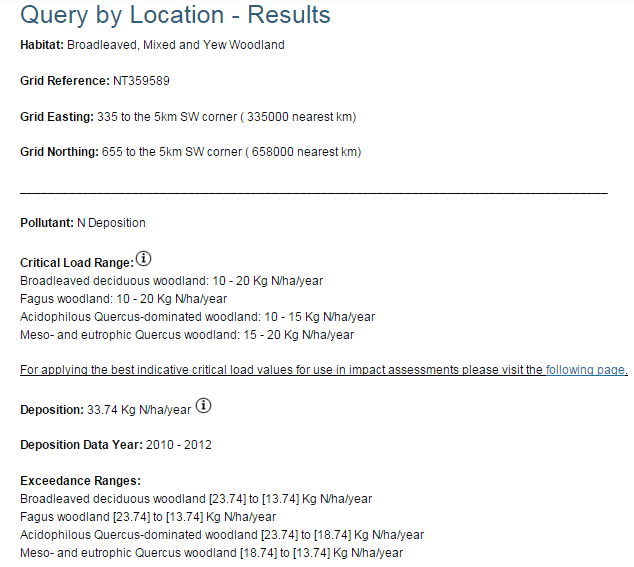
Figure 11 - The "Search by Location" results window.
The results section above shows the critical load/level and the deposition for that combination of habitat and pollutant. Critical loads for nitrogen (as above) cover a number of different types. In this case exceedances are calculated for each type. Data sources can be viewed by clicking on ![]() , and a UK map of deposition or concentration can be viewed by clicking on
, and a UK map of deposition or concentration can be viewed by clicking on ![]() .The exceedance is calculated and shown; a negative exceedance signifies no exceedance (from the example above an exceedance is present at this location for each critical load type).
.The exceedance is calculated and shown; a negative exceedance signifies no exceedance (from the example above an exceedance is present at this location for each critical load type).
Figure 12 shows the Biomonitoring section of APIS.
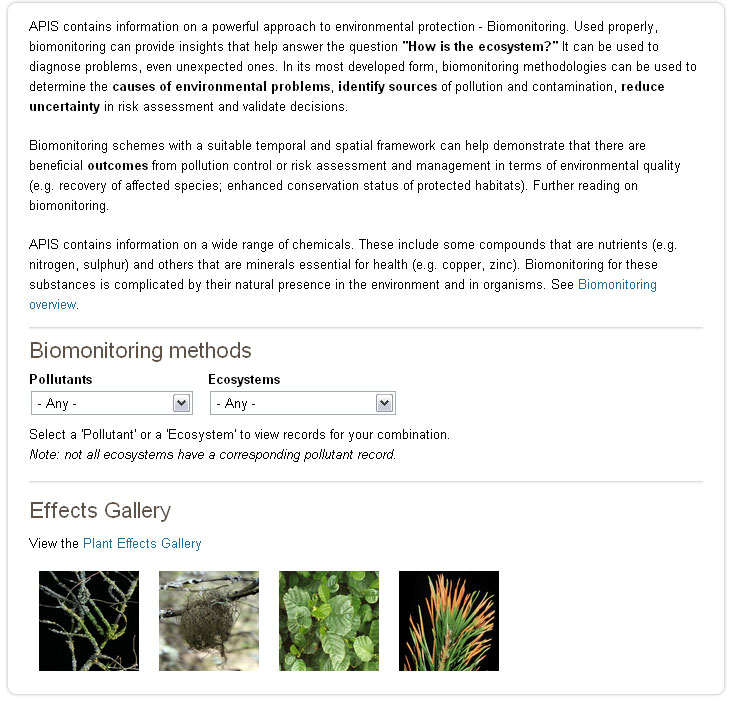
Figure 12: Biomonitoring home page.
Each biomonitoring method has been assessed for its robustness, ease of use and state of development. A link is provided on the home page to access a guide in how to use this information (see Figure 12 above). Figure 13, below, show this guide.
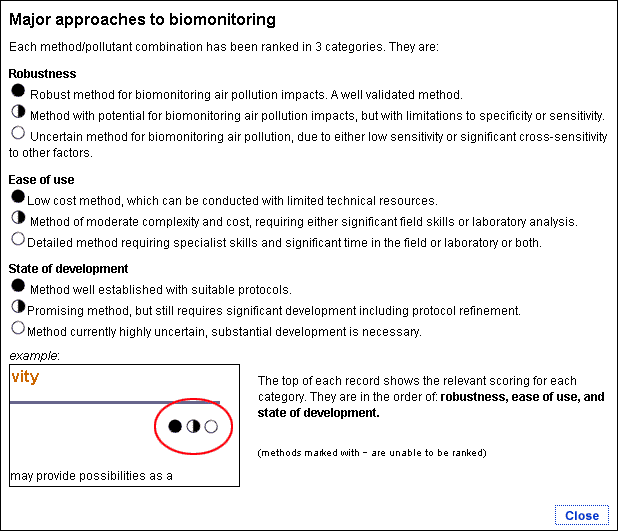
Figure 13: Ranking system for assessing each biomonitoring method
From Figure 13 above each category is ranked in 3 levels, and each level is represented by a full, shaded or empty circle. At the top of each method record these circles show the relevant scoring for each category. They are in the order of robustness, ease of use, and state of development.
Select a pollutant and an ecosystem to reveal suitable biomonitoring records. These are hyperlinks which can when clicked give the full biomonitoring record as seen in Figure 14.
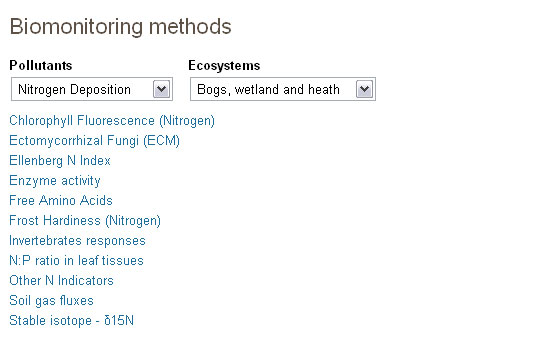
Figure 14: Select an ecosystem.
Figure 15 shows the complete biomonitoring method record.
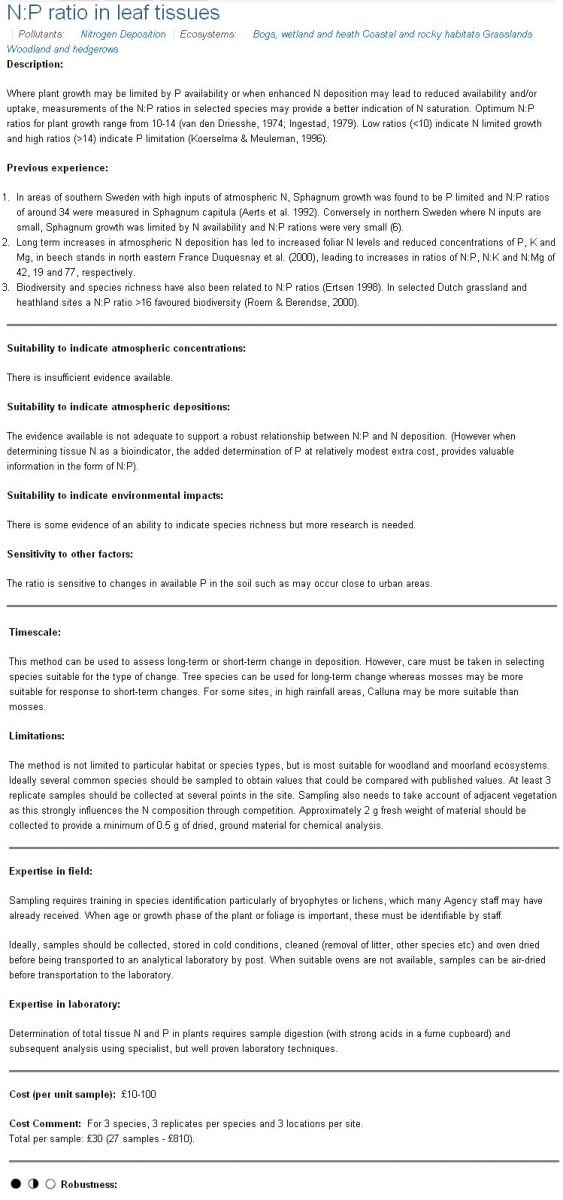
Figure 16: The full biomonitoring record.
A description of each category in the biomonitoring record is listed below:
- Basis of the approach: gives a brief description of the method
- Previous experience: is there any previous experience with this method?
- Suitability to indicate atmospheric concentrations: is the method suitable and robust at indicating atmospheric concentrations ?
- Suitability to indicate atmospheric deposition: is the method suitable and robust at indicating atmospheric depositions?
- Suitability to indicate impacts: is the method suitable and robust at indicating impacts?
- Sensitivity to other factors: this lists levels of cross sensitivity which may cause confounding interpretation.
- Timescale: the time period over which an effect can be observed or measured. Note: this is not the time taken to analyse a sample.
- Limitations: are there limitations to habitat types or species groups? What is the required quantities of survey vegetation or sampling material? Are there any ethical issues with collecting samples (e.g. birds eggs)?
- Simplicity in the field: is there a need for specialist staff to take samples (either specialist equipment or identification skills), and for specialist sample transport.
- Simplicity in the lab: is there a need for specialist processing of samples or data, in order to calculate results?
- Cost: indicates the cost per unit of sampling (e.g. one SAC sampled at the edge, centre and an intermediate location at one time). Also includes an indication of the number of person days of required (Agency + External specialists) in field and laboratory.
- References: a full reference list accompanying the record
3.8. Help/General Information on Atmospheric Pollution
This section at the margin of the home page (Figure 1) contains links to a glossary of scientific terms, a list of relevant literature, a comments page and tables of unit conversions:
-
The Glossary contains brief descriptions of scientific terms relevant to the database and overview sections, including links to other terms and the overview sections for further information (see also: Glossary button on all Database Search results windows).
-
The list of relevant literature contains all references mentioned in the overview sections and the database, in alphabetical order. Click on the link to download the Reference Word file.
-
Unit Conversion tables: This provides tables and equations to convert air concentrations of pollutants from µg m-3 to ppb and vice versa.
- Comments: A contact form gives you a chance to ask any questions or make any comments about the content of the site.

