Ozone (O3) is present throughout the atmosphere although there are concentration peaks at two levels, the stratosphere (15 - 50 km) and troposphere (0-15 km), with the largest fraction and concentrations being in the stratospheric O3 layer ( Royal Society, 2008). Stratospheric O3 is important as it regulates the transmittance of ultraviolet light to the surface of the earth. Hence reductions in stratospheric O3 in polar regions, particularly the Antarctic "ozone hole", are of concern regarding the health effects of exposure to increased levels of UV-B.
In contrast, O3 in the troposphere (ground level) is regionally important as a toxic air pollutant and greenhouse gas. Mixing with stratospheric air provides a natural global average background of around 10-20 parts per billion (ppb), though there is some debate about the concentration. Additional quantities of tropospheric O3 are produced by photochemical reactions from nitrogen oxides (NOX) and volatile organic compounds (VOCs), which include various hydrocarbons.
Formation and Sources
Ground-level ozone (O3) is not emitted directly from anthropogenic sources. It is a “secondary” pollutant formed by a complicated series of chemical reactions in the presence of sunlight. Photochemical reactions of NOx and VOCs (originating from largely from combustion processes) govern the concentration of ground-level O3 in the atmosphere. Under typical daytime conditions with a well-mixed atmosphere, three reactions reach equilibrium and no net chemistry occurs.
NO + O3 -> NO2 +O2 (1)
NO2 + hn -> NO + O (2)
O + O2 -> O3 (+ M) (3) where hn = sunlight with wavelength 280-430 nm
M = any molecule eg N2 or O2
The chemical reactions do not take place instantaneously, but can take hours or days. Ozone levels at a particular location may have arisen from VOC and NOx emissions many hundreds or even thousands of miles away. Maximum concentrations, therefore, generally occur downwind of the source areas of the precursor pollutant emissions.
Anthropogenic emissions of the ozone precursors (NOx/VOCs) can also cause large transient increases in ozone concentration, termed episodes or smog. These occur when high concentrations of precursors coincide with weather conditions favourable for ozone production such as when the air is warm and slow moving.These "ozone episodes" provide concentrations of O3 (>40 ppb) which are toxic both to human health (with a long term threshold objective of 50 ppb daily 8-h mean, WHO) and vegetation.
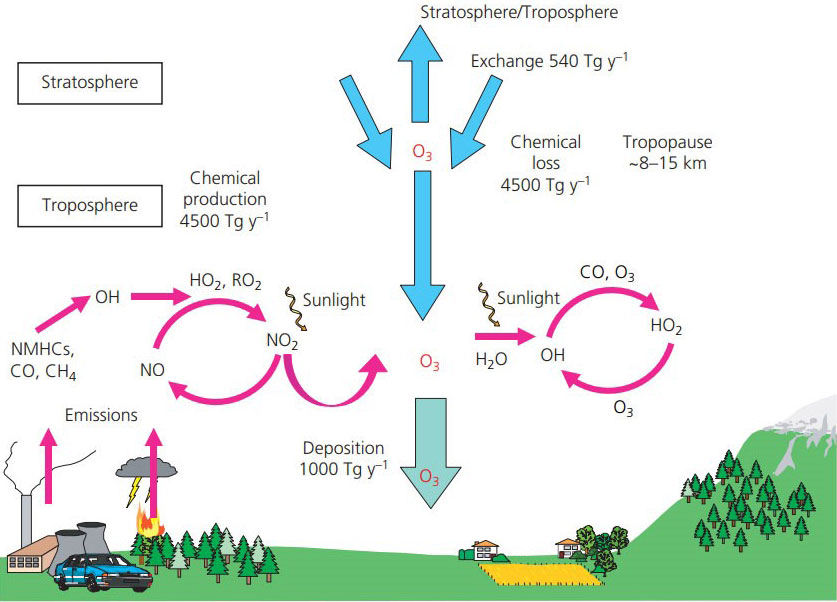
Figure 1: A schematic view of the sources and sinks of O3 in the troposphere. Annual global fluxes of O3 calculated using a global chemistry–transport model have been included to show the magnitudes of the individual terms. These fluxes include stratosphere to troposphere exchange, chemical production and loss in the troposphere and the deposition flux to terrestrial and marine surfaces. Data source: IPCC Fourth Assessment Report Working Group I Report “The Physical Science Basis“ (Denman et al. 2007).
Prior to the industrial revolution natural sources of NOX and VOCs (see table) would have generated O3 in the troposphere, adding to that transported from the stratosphere. However, the large amounts of NOX and VOCs released by human activities, such as the combustion of fossil fuels, has led to a large increase in the northern hemisphere background concentration. Evaluation of historical O3 measurements indicate that since the 1950s, the background ozone concentration has roughly doubled (Volz and Kley, 1988, Vingarzan, 2004), although there has been some slowing down of this trend in the last decade (Derwent et al., 2013).
|
Table 1: Summary of Ozone formation from natural and anthropogenic NOX and VOC sources |
|||
|
NOX |
VOC |
||
|
Natural |
Anthropogenic |
Natural |
Anthropogenic |
|
Soils, natural fires |
transport (road, sea and rail), power stations, other industry and combustion processes |
Vegetation, natural fires |
Transport, combustion processes, solvents, oil production |
Concentrations
Policy actions to date across Europe have reduced the emissions of ozone precursors NOx and VOCs. These emission controls have reduced peak ozone concentrations by typically 30 ppb in the UK, but over the last 20 years mean concentrations have been increasing in urban areas due to reductions in the local depletion of O3 by NO. Background concentrations have increased in rural areas due to increases in the hemispheric background O3 concentrations which have increased by approximately 0.2 ppb per year, or by about 5 ppb (Figure 2 ). The cause of the increases in background O3 are increases in precursor emissions throughout the northern hemisphere, including shipping, aircraft, vehicle, and industrial emissions in developing economies.

Figure 2: Trends in monthly mean baseline ozone levels at Mace Head on the west coast of Ireland between 1986 and 2006, including a running 12-month mean (pink line), showing the ~5 ppb increase in ozone mixing ratios over 20 years.
Ozone concentrations are highly variable, spatially and temporally. Figure 3 shows the high background concentration in March to May over the northern half of Scotland, upland Wales and northern England, and parts of southern and eastern England. In the summer months of May-July high concentrations cover parts of south-east England and some upland areas of Wales and northern Scotland. The summer time spatial pattern extends across Western Europe and is caused by regions where ozone production occurs more frequently in a combination of precursor emissions (NOx and VOCs), high solar radiation and temperatures. During the winter the highest concentrations occurring in the NW and the lowest in the SE as a consequence of ozone destruction in the NO polluted atmosphere of the dense urban/industrial regions of the southern UK and continental Western Europe.

Figure 3: Distribution of mean ozone concentrations over the periods March-May and May-July, using data for the five year period 2003-07.
Effects
A large body of evidence has shown that ambient O3 causes damage to O3-sensitive vegetation. O3 enters leaves via the stomatal pores on the leaf surface. Once inside the leaf, a series of chemical reactions occur leading to damage to cell membranes and other negative impacts on plant metabolism, including photosynthesis. These effects can be in response to short-term episodes or cumulative during the growing season, and can lead to:
- Visible leaf damage and premature aging of leaves;
- Reductions in above- and below-ground growth and biomass;
- Changes in the ratio between shoot and root biomass (including carbon allocation);
- Reductions in flower number, flower biomass and seed production;
- Reductions in crop yield quantity and quality, including cereal grains, potato tubers and tomato fruit;
- Changes in forage quantity and quality for pasture;
- Altered tolerance to abiotic stresses such as drought and frost and biotic stresses such as pest attacks and diseases
Critical Levels
Ozone pollution effects on vegetation are described by cumulative metrics that are based on either atmospheric concentration of O3 over a threshold concentration (AOT40) or modelled uptake of O3 through the stomatal pores on the leaf surface (Phytotoxic Ozone Dose above a threshold of Y, PODY). A recent analysis of field evidence for O3 effects confirmed that maps generated using an O3 flux metric more closely matched locations of damage than those based on O3 concentration (Mills et al., 2011a). New O3 flux-based critical levels have been derived for crops, tree species and for grassland species (Mills et al., 2011b). See the overview on Guide to Critical Loads and Levels.
Other Impacts
The role of ozone as a contributor to the direct radiative forcing of global climate has grown in importance (IPCC, 2007). In addition, the recognition that the effects of O3 on carbon sequestration through its effects on primary productivity of vegetation is an additional reason for interest in ground level ozone (Sitch et al., 2007).
Further Reading (full references below)
The Royal Society (Royal Society, 2008) undertook at major review of ozone in 2008. They showed that action at a hemispheric scale is required effective control of ground level ozone.
The ICP Vegetation report 2017 on the Mapping of critical levels of vegetation provides an in-depth description of the methodology and approaches that has been researched for setting critical levels for ozone. Further reports and information are also available on the ICP Vegetation website.
The Review of Transboundary Air Pollution (RoTAP) report includes several chapters on Ozone and its effects including:
- Section 5.4.8 Assessment of current impacts of ozone in the UK
- Section 7.3.1 Trends in ozone concentration