- Introduction
- SRCL Home Page
- Search by Site
- Select a Site
- NEW Results Page for SACs, SPAs, and English SSSIs
- NEW Results Page – Enter a grid reference
- SSSIs in Wales, Scotland and Northern Ireland ONLY
- Select a Feature – A/SSSI (Not England)
- Results Page - A/SSSI (Not England)
- ALL SITES - Source Attribution Tab
- Results Page for SPAs and SAC species
Introduction
Currently the route to the Results page is undergoing a transition. For SACs, SPAs and English SSSIs the user has only to select a Site - the results page then displays all the features in a collapsible table format making it easier for the user to compare feature information. For Scottish, Welsh and Norther Irish SSSIs the user still has to select a feature and then proceed to the Resutls page on a feature by feature basis.
The Site Relevant Critical Loads tool provides critical loads for acidity and nutrient nitrogen for designated features (sometimes refered to as 'interest features') within an SAC, SPA or A/SSSI site. A user can view an overview of results on critical loads, impacts and source attribution for each interest feature at each site. Critical loads for nutrient nitrogen and/or acidity are assigned to each sensitive interest feature on each site. Furthermore, deposition data for nitrogen and sulphur at each site is provided, apportioned to major sources, and presented in pie charts. Users can also select a grid reference if they know the exact location of their interest feature in order to get the most geographically relevant deposition data or acidity critical loads data.
This user guide will walk you through examples of the selections screens and will also explain what the results mean.
The SRCL homepage is the starting point for looking up data on a particular site or source. This page also includes links to the project report, user guide and online tutorials.
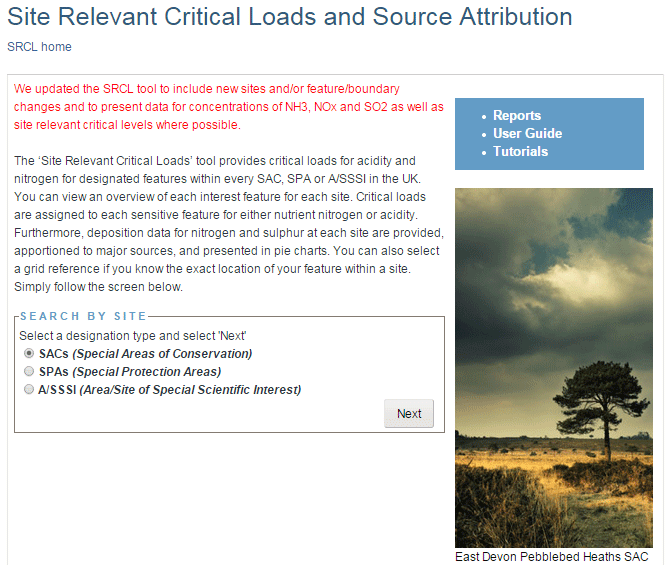
Figure 1: SRCL hompage showing ‘Select by Site’
Select a designation type (e.g. SAC) then click ‘Next’.
Select a Site
There are two ways of selecting a site. You can either:
1. Start typing in the ‘Site’ input box to show the site lists (see Figure 2). After 2-3 characters the list will appear. It is not case sensitive. Then you must select the site (e.g. Dungeness) from the drop-down list and click ‘Next’
2. Choose the site from the list below (Site Selection box), which can be filtered by country (e.g. England). Select your site (e.g. Dungeness) in this box and click ‘Next’.
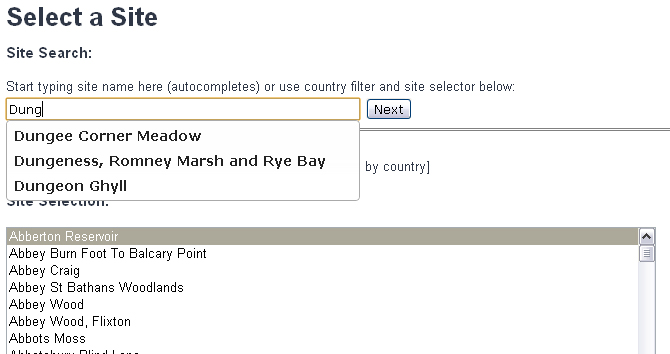
Figure 2: Select a site screen showing predictive text box for site searching
Some sites in the database do not contain interest features which have been assigned critical loads. These are A/SSSIs which have species features only (we only assigned critical loads to A/SSSI habitat interest features - see Section 15) and sites which are only designated for geological features. When a user selects a site with no interest features mapped to critical loads the following alert is displayed as shown in Figure 3.
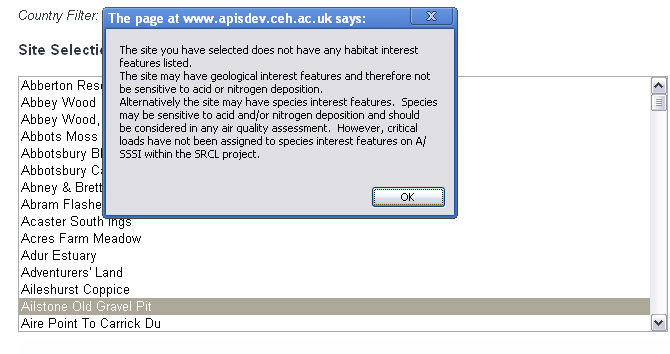
Figure 3: Alert box when no interest features are present
NEW Results Page for SACs, SPAs, and English SSSIs
For SACs, SPAs, and English SSSIs the user no longer has to select indivdual features, all features are displayed on one Results page (see Figure 4 below).
This is the new Results page showing a list of all the features at that site. The tabs provide information on critical loads and levels for 5 key pollutants - nutrient nitrogen, acidity, ammonia, nitrogen oxides (NOx) and sulphur dioxide (SO2). Other tabs provide information on the concentrations and depositions at a site, the critical load exceedances together with graphs and source attribution. Features are by senstivity with the most sensitive at the top of the list.
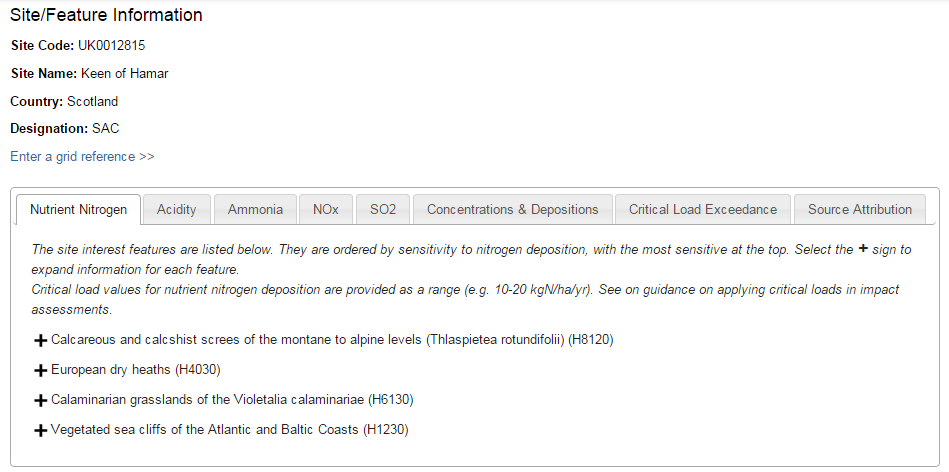
Figure 4: Results page showing all features at a site
By clicking on the + icon you can view the full inforamtion for each feature (Figure 5). Information is provided as to whether the feature is senstive or not and crtical loads/levels are given where available.
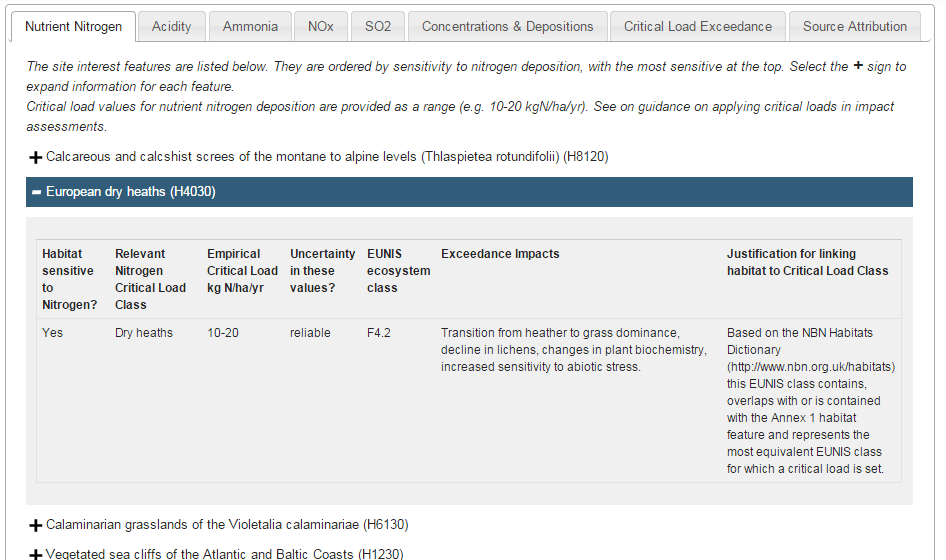
Figure 5: Resutls page with 'clickable' icons to show details for each feature.
The 'Concentration & Deposition' tab shows the concentrations and depositions across the site (Figure 6). This are given as a maximum, minimum and average values. Each feature has its own set of site values as pollutant deposition to some habitats (e.g. forest habitats) have higher deposition values.
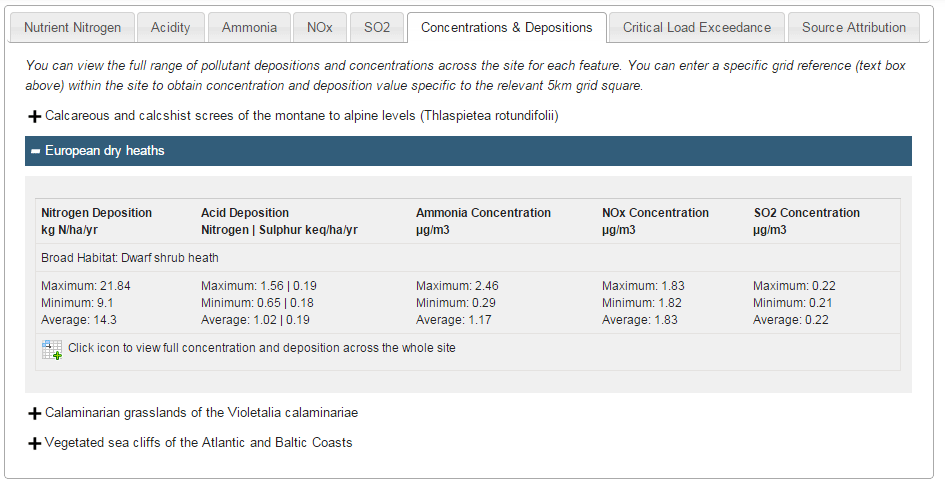
Figure 6: Site depositions and concentrations tab
In additon to simple site statistics users can also click on the ![]() icon to get a full list of depositions and concentrations at a site (Figure 7). Pollutant depositions and concentrations are mapped at a 5km resolution across the UK. The tables provide a list of every grid square that overlaps the site boundary and the corresponding values.
icon to get a full list of depositions and concentrations at a site (Figure 7). Pollutant depositions and concentrations are mapped at a 5km resolution across the UK. The tables provide a list of every grid square that overlaps the site boundary and the corresponding values.
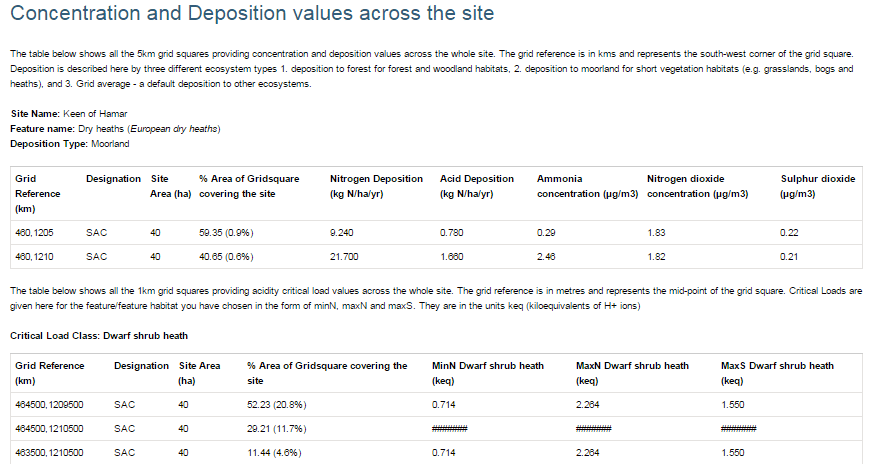
Figure 7: Concentration and deposition values across the whole site.
Critical loads graphs for nutrient nitrogen and acidity are also provied for each senstive feature as shown in Figure 8.
For nitrogen, the graph displays the upper and lower end of the critical load range relevant to the interest feature selected. Deposition is plotted (in red). The use of ranges for empirical nitrogen critical loads are based on a number of factors including:
- real intra-ecosystem variation between different regions where an ecosystem has been investigated;
- the finite intervals between additions of nitrogen in experiments; and
- uncertainties in estimated total atmospheric deposition values, although these have been checked by local specialists on atmospheric nitrogen deposition.
For every interest feature, the empirical nitrogen critical loads are set with an indication of their reliability and of the effects to be expected in the case of exceedances.
The acidity critical load is represented by the critical load function graphs as seen in Figure 10. In cases where a grid reference has not been specified, and a site covers more than one 1km2 grid square for which acidity CLs are calculated, the minimum CL function and maximum CL function is presented to show the range of sensitivity across the site.
For further information on critical loads, including the critical load function, please visit the Critical Loads overview.

Figure 8: Critical loads graphs for nutrient nitrogen and acidity
Finally the 'Source Attrobution' tab (Figure 9) provides a link to a seperate page that shows, in a pie chart, the contribution of a source at a site for nitrogen and sulphur (Figure 9).

Figure 9: Source attribution tab
Enter a grid reference
Users also have the ability to enter a known grid reference for their interest feature. This is because the deposition of nitrogen and acidity and critical loads for acidity are based on a grid of 5km and 1km respectively. This means that the deposition and critical load data for each site is worked out as an average when the boundaries of a site cross more than one deposition and/or critical load squares. However by entering a grid reference the user can home in on a particular grid square.
Enter your grid reference in the Landranger format (NJ6922578) or the OS format (123456,123456) as shown in Figure 10
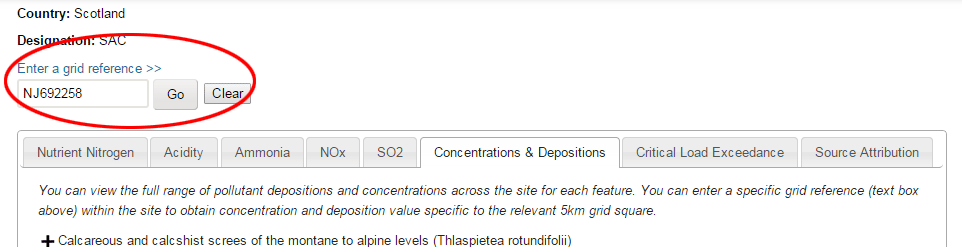
Figure 10: Entering a grid reference
SSSIs in Wales, Scotland and Northern Ireland ONLY
Select a Feature
For A/SSSI in Wales, Scotland and Northern Ireland, the “select an interest feature” screen is still provided as the categories used to define habitat interest features are very broad in their classification. They are based on the reporting categories used by JNCC for A/SSSI reporting in 2006. First, you will need to select the reporting category for the interest feature you wish to assess (top window), then a new set of habitats will be shown in the second window (see Figure 11). These are more detailed to give you a better chance of selecting the right feature habitat for the site you are looking at. For guidance on the relationship between the relevant reporting categories used in APIS and Broad and Priority habitats, please read the background page to assigning critical loads to A/SSSIs (link in the red highlight circle)
The reporting categories are listed in order of sensitivity based on the critical loads relevant for the reporting category. Note that there may be a wide range of sensitivity to nitrogen or acidity with a single reporting category. However, the lowest critical load corresponding with the reporting category is used to order the sensitivity.
Select an interest feature and click ‘Next’.
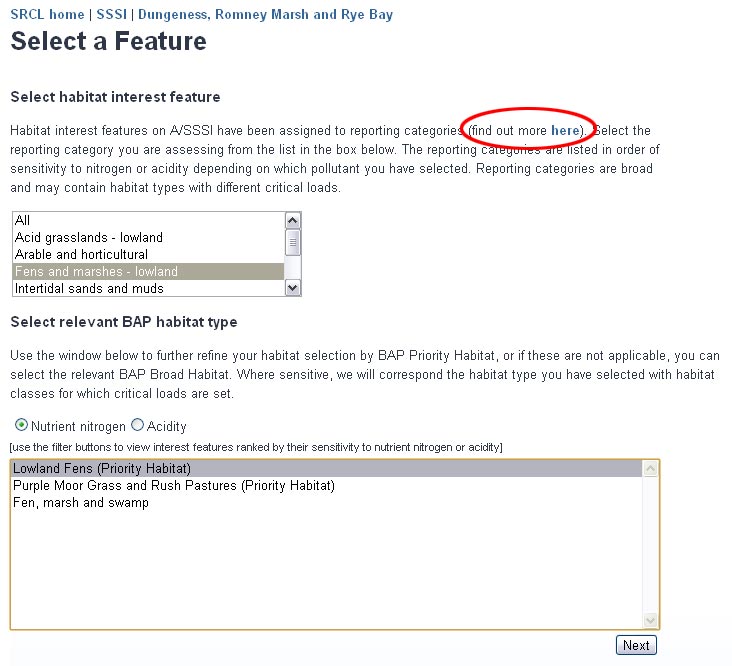
Figure 11: Selecting habitats for A/SSSIs
Results Page
The results page for non English A/SSSIs varies from that of SACs and SPAs. The user will sometimes be required to further define the habitat type at the site in order to select the relevant critical load based on EUNIS type (EUNIS is a European habitat classification upon which nutrient nitrogen critical loads are based). This is because there is sometimes a range of sensitivity, and hence a number of critical loads, associated with the broad/priority habitat selected and so the user has to choose the best fit with the A/SSSI they are interested in. Links to habitat correspondence tables provided by JNCC and to site information provided by the country conservation agencies should be used to help pinpoint the best EUNIS habitat. On selecting a EUNIS habitat the tabbed content is updated in an instance. The “select a EUNIS Habitat” box includes all the EUNIS types which correspond with the priority or broad habitat selected. Not all of these will have nitrogen critical loads associated with them because nitrogen critical loads are only set for a subset of habitats within the classification (reflecting which habitats have been studied and hence for which there is empirical evidence). The EUNIS categories are listed by sensitivity so if you do not know which is relevant to the interest feature for the site you are reviewing, in first instance (e.g. for screening assessments) pick the most sensitive.
Site/Feature Information
The site/feature information area provides an overview of the selected site code and name, interest code and name. Both the Site code and Interest code are provided as links which connect to the JNCC web pages of site and interest overviews.
Impacts and Critical Loads
The information in the first tabbed area gives the basic sensitivity information for nutrient nitrogen and acidity. Use the justification buttons ( ![]() ) to show what the justifications are for assigning critical load classes to the habitat features.
) to show what the justifications are for assigning critical load classes to the habitat features.
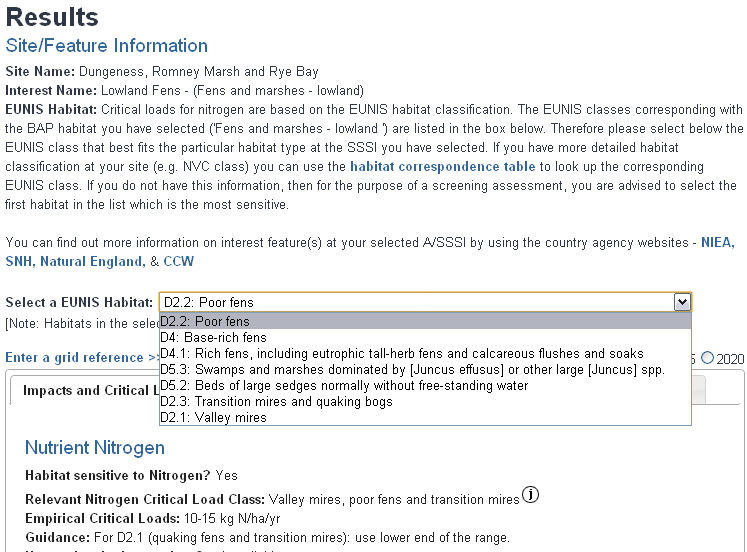
Figure 12: Results page for A/SSSIs
Deposition and Critical Load Graphs
The Deposition and Critical Load Graphs Tab provides information on the nitrogen and acidity critical loads and plots them against the pollutant deposition (plotted as red dot) (Figure 13). The tab also provides information on the types of impacts expected as a result of exceedance.
For nitrogen, the graph displays the upper and lower end of the critical load range relevant to the interest feature selected. Deposition is plotted (in red). The use of ranges for empirical nitrogen critical loads are based on a number of factors including:
- real intra-ecosystem variation between different regions where an ecosystem has been investigated;
- the finite intervals between additions of nitrogen in experiments; and
- uncertainties in estimated total atmospheric deposition values, although these have been checked by local specialists on atmospheric nitrogen deposition.
For every interest feature, the empirical nitrogen critical loads are set with an indication of their reliability and of the effects to be expected in the case of exceedances.
The acidity critical load is represented by the critical load function graphs as seen in Figure 13. In cases where a grid reference has not been specified, and a site covers more than one 1km2 grid square for which acidity CLs are calculated, the minimum CL function and maximum CL function is presented to show the range of sensitivity across the site.
For further information on critical loads, including the critical load function, please visit the Critical Loads overview.
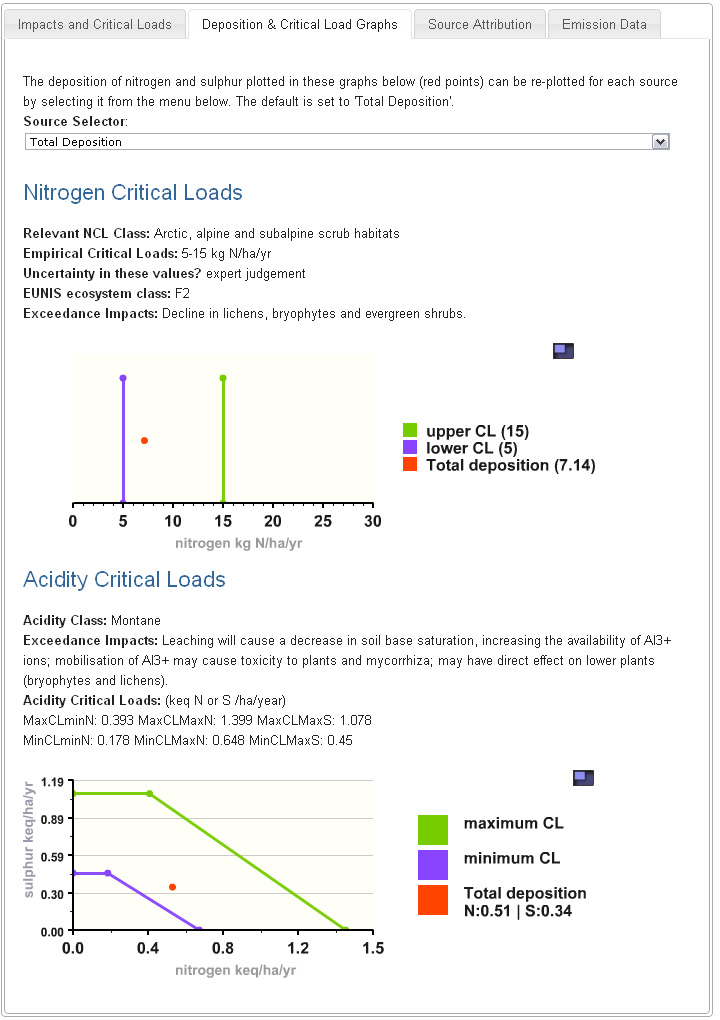
Figure 13: Results Page – showing the critical loads graphs
Source Attribution - ALL SITES
The pie charts below show the proportion that each source contributes to the total deposition of nitrogen and sulphur to the selected feature at the selected site. 156 sources were modelled and the pie chart shows the sources that contribute the most deposition at each site. At every site, the total deposition is the sum of individual source contributions to deposition. For detailed information on each source, the user can open the ‘Emission Data’ tab (Figure 12) where a table of the emission statistics of each source for 2005 (‘current’ year) and 2020 (future year) can be found. The individual source values are rounded so will often not add up to the Total Deposition.
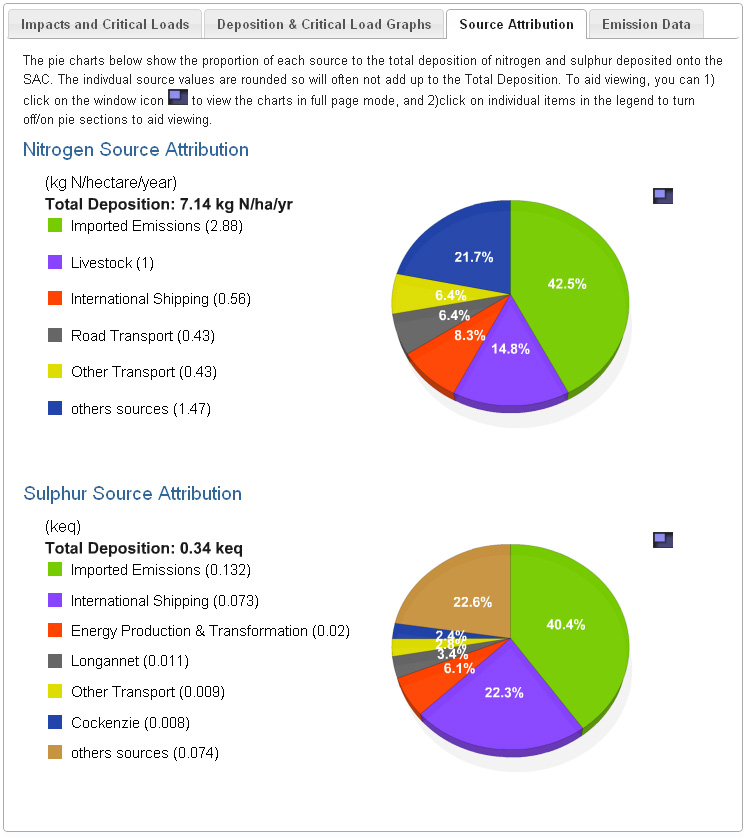
Figure 14: Source attribution pie charts for the site
Emission Data
The emission data tab (Figure 13) provides a table of all the sources that were modelled for the SRCL tool. There are around 156 sources in total, each source contributing an apportioned amount of nitrogen and sulphur deposition to each designated site. The total deposition (as seen plotted on the critical load graphs - red point) is the sum of all the sources at any one site. The table is ranked by nitrogen and sulphur emissions showing the largest emitters at the top.
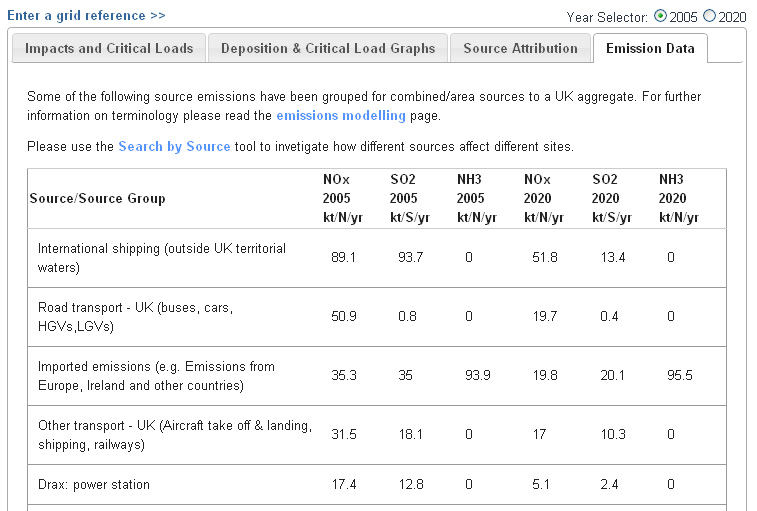
Figure 13: Emission Data tab showing table of all source emissions for each modelled year.
Results for SPAs and SAC species
Critical loads are not established specifically for species (e.g. birds). In order to assess the impacts of nitrogen deposition and acidity on bird species and assemblages, or Annex II species, consideration is given to how a change in the species’ habitat, as a result of deposition, could indirectly impact the species. So critical loads are assigned to the supporting habitat for the species and a scientific judgment is made as to whether the impacts on the habitat would translate into an indirect effect on the species.
Therefore, for bird features or other species, although the habitat on which it depends (breeds, feeds or roosts) may be sensitive, the features themselves may not be negatively affected by the change in the habitat as a consequence of critical load exceedance (Figure 14). In this example the impact on the Osprey’s nesting habitat - ‘Coniferous Forest ‘ does not affect the Osprey itself – so it is deemed not sensitive. The results page still provides information on critical load exceedance of the supporting habitat.
In some cases there is more than one habitat listed for the species on the results page, to reflect where the species/assemblage resides, breeds, feeds or roosts. You should use the habitat which is relevant for the interest feature at the site you are assessing. From the example in Figure 14 you can see that there are two rows for Osprey: broad habitats ‘Standing open waters and canals’ and ‘Coniferous Forest’.
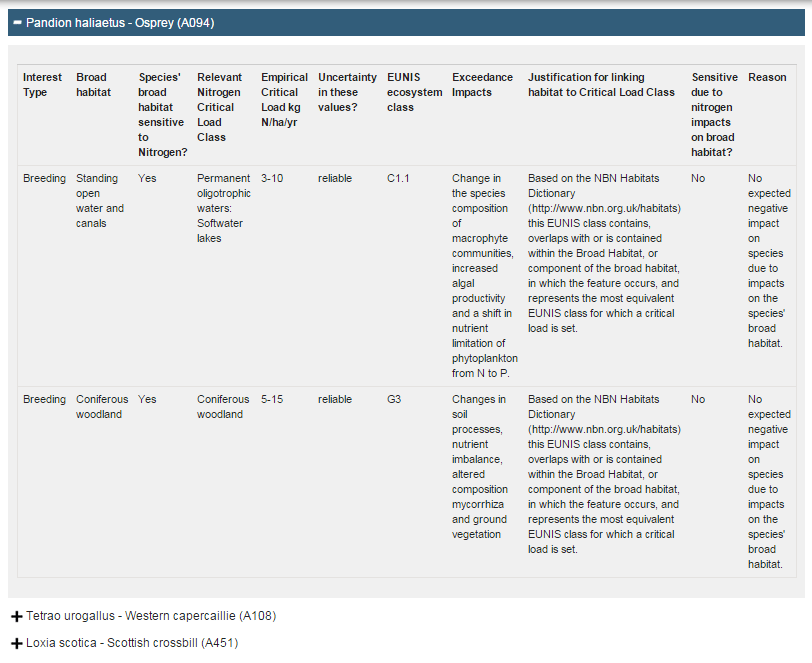
Figure 14: New Results page for SPAs showing multiple habitats in the table.