Impact Type: Direct exposure to pollutant
Key Concerns:
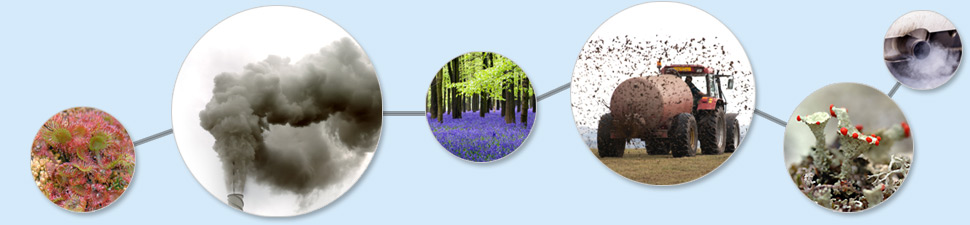
It has long been known that SO2 has an effect on lichen growth, maps using the decline of lichens as a system for the measuring SO2 levels were available before the First World War (Dudley & Stolton 1996).
Studies suggest that atmospheric SO2 and NO2 are the two most important factors in determining levels of lichen biodiversity (Hawksworth & Rose 1970a,b, Richardson 1988, van Dobben et al. 2001). However it should be noted that not all lichen species are affected by exposure to SO2 and some species are more tolerant that others. For example, Lecanora conizeoides is tolerant of and can benefit from the presence of some SO2 (van Dobben et al. 2001). Consequently L. conizeoides may be in decline in some areas following reduction in SO2 levels (Bates et al. 1990). It has also been found that species which are sensitive to one form air pollution, are not automatically sensitive to others (van Dobben & ter Braak 1998, 1999, van Dobben et al. 2001).
Additional Comments:
In the late 1960's Hawksworth & Rose (1970a,b) developed a ten point scale for predicting levels of SO2 in the air in England and Wales using the lichens growing on trees which is still in use. However, recent analysis (Bates 2001, van Dobben et al. 2001, van Dobben 1996) suggest that this scale now need to be revised downward to reflect a changing pollution climate.
Hawksworth & McManus (1998) have reported lichen recolonization in London corresponding to the decline of SO2. They report finding 25 species which had not been recorded within 16 km of the centre of London in the 20th century, 8 of which had not been seen during the previous 200 years. A similar pattern was observed in Finland over 20 years from 1980 (Ranta, 2001). The role of lichens as bioindicators of SO2 pollution has been reviewed by Nash & Gries (2002).
Critical levels have been set according to different species groups (for more detail see Ssp. groups, e.g. Lobaria spp.), based on the Hawksworth & Rose scale (Hawksworth & Rose 1970a,b), but this is currently under review as critical levels may be smaller than previously estimated.
| Habitat/ Ecosystem Type | Critical Load/ Level | Status | Reliability | Indication of exceedance | Reference |
|---|---|---|---|---|---|
| Forests and semi-natural vegetation |
20 µg SO2 m-3 annual mean and half-year(Oct-March) mean |
UNECE, 2004 | quite reliable i.e. the results of some studies are comparable |
Low temperature appears to enhance the negative effects of SO2, and the lower critical level of 15 µg SO2 m-3 is used where the effective temperature sum (ETS) (i.e. the sum of temperatures) above 5oC is below 1000 degree days (d.d) (Ashmore et al., 1994). |
809 |