
Method for calculating exceedance of the acidity critical load function and the contribution from a source
1. Introduction
APIS provides acidity critical load data via the Search by Location and the Site Relevant Critical Loads tools. Deposition of sulphur and nitrogen compounds can contribute towards acidification. Therefore, both should be taken into account when assessing potential acidification impacts. The critical load function has been developed to account for both sulphur and nitrogen inputs. The function is defined by three quantities CLmaxS, CLmaxN and CLminN.
Critical loads are used by the environment agencies, conservation agencies and others as benchmarks against which to assess the potential impacts of atmospheric deposition. APIS provides a tool for calculating exceedance of the acidity critical load function and for comparing nitrogen and/or sulphur deposition from a source to the critical load function.
Here we explain the concept of the acidity critical load function and the method APIS provides to calculate the contribution from source(s) to the critical load function.
2. Explanation of the acidity critical load function
In the UK, empirical critical loads of acidity for soils have been assigned to each 1km grid square of the country based upon the mineralogy and chemistry of the dominant soil series present in the grid square. The soil series are assigned to one of five critical load classes. These are based on the principle that the capacity to buffer acid deposition is determined by the annual production of base cations from mineral weathering. This classification, based on weathering rates and mineralogy, is inappropriate for peat soils, which contain little mineral material. Instead, for peat soils, acidity critical loads are based on the concept of effective rain pH i.e. total acidifying pollutant load divided by runoff. The simple mass balance (SMB) method is for calculating acidity critical loads for woodland ecosystems. It is based on balancing the acidic inputs and outputs from a system, to derive a critical load which ensures that a critical chemical limit (related to effects on the ecosystem) is not exceeded.
Deposition of both sulphur and nitrogen compounds can contribute to exceedance of the acidity critical load. The Critical Load Function, developed under the UNECE Convention on Long-Range Transboundary Air Pollution (CLRTAP) defines combinations of sulphur and nitrogen deposition that will not cause harmful effects (see http://www.rivm.nl/en/themasites/icpmm/manual-and-downloads/index.html). It therefore allows you to consider the combined inputs sulphur and nitrogen deposition. The Critical Load Function is a three-node line on a graph representing the acidity critical load. Combinations of deposition above this line would exceed the critical load, while all areas below or on the line represent an “envelope of protection” where critical loads are not exceeded (see figure 1).

The maximum critical load of sulphur (CLmaxS) is the critical load for acidity expressed in terms of sulphur[1] , i.e. when nitrogen deposition is zero. The maximum critical load of nitrogen (CLmaxN) is the critical load of acidity expressed in terms of nitrogen only (when sulphur deposition is zero). The long-term nitrogen removal processes in the soil (for example, nitrogen uptake and immobilisation) define a “minimum” critical load for nitrogen (CLminN). N deposition inputs below the CLminN will not acidify the system. After CLminN is reached, additional N will contribute towards acidification. For further explanation see Hall et al (2003).
The CLmaxS, CLmaxN and CLminN are defined as:
CLmaxS = CL(A) + BCdep - BCu
– Where CL(A) = acidity critical load (empirical or SMB)
– BCdep = base cation deposition
– BCu = base cation uptake by vegetation (=0 for most habitats)
CLmaxN = Nu+Ni+Nde
– Where Nu = nitrogen uptake
– Ni = nitrogen immobilisation
– Nde = denitrification
CLmaxN = CLminN + CLmaxS
3. Calculating exceedance of the critical load function
Combinations of sulphur and nitrogen deposition ‘above’ the critical load function line exceed the critical load. There is no unique set of N and S deposition reductions which can be implemented to achieve compliance with the critical load function: it depends on the relative inputs compared to the function line. For example, in some areas of the diagram either S or N or both could potentially be reduced to achieve compliance, whilst in others, it may be necessary to reduce specifically S or specifically N. The mapping manual[2] of CLRTAP provides methods for calculating exceedance of the function based on deposition of sulphur and nitrogen and a given critical load function as the sum of the sulphur and nitrogen deposition reduction required to reach the critical load function by the “shortest” path”. These equations are provided below.
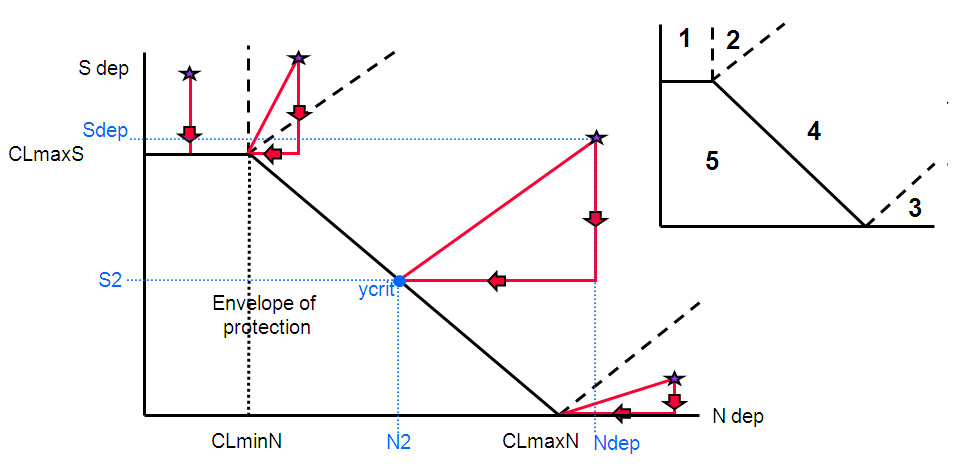
[ ycrit = intercept of S&N dep on CLF; S2 = intercept on Sdep-axis from ycrit; N2 = intercept on Ndep-axis from ycrit]
Region 1: Sdep > CLmaxS & Ndep < CLminN
Exceedance = Sdep – CLmaxS
Region 2: S2 > CLmaxS
Exceedance= (Sdep – CLmaxS) + (Ndep – CLminN)
Region 3. N2 > CLmaxN
Exceedance= Sdep + (Ndep – CLmaxN)
Region 4. Sdep > ycrit & S2 <= CLmaxS & N2 <= CLmaxN
Exceedance= (Sdep – S2) + (Ndep – N2)
Region 5. Sdep <= ycrit & Sdep <= CLmaxS & Ndep <= CLmaxN
Not exceeded
However, since CLmaxN=CLmaxS+CLminN, at any point on the critical load function slope where the point on the x axis is >CLminN, the value in total keq/ha/yr is equal to CLmaxN. Therefore, the above set of equations can be simplified to calculate exceedance as (Environment Agency 2003, Skeffington et al, 2006; 2007; Heywood et al, 2007):
Where N Deposition > CLminN
Exceedance (keq/ha/yr) = S+N deposition – CLmaxN
Where N Deposition < CLminN
Exceedance (keq/ha/yr) = S deposition – ClmaxS
4. Calculating the process contribution and predicted background as a proportion of the critical load function
Section 3 showed how exceedance of the critical load function can be calculated. Critical loads are used as a benchmark against which to consider the potential impacts of sources, for example, assessment of emissions to air from an installation requiring an environmental permit.
In such assessments, it is necessary to account for “background” deposition and consider whether the process under assessment results in a worsening of exceedance, or whether it moves a site from non-exceedance to exceedance, and by how much. To do this, the agencies consider the process contribution (PC) and predicted total deposition (equivalent to the concept of Predicted Environmental Concentration and for consistency referred to as PEC) as a proportion of the critical load function.
It is important that the combined effects of the inputs of sulphur and nitrogen are considered. Therefore, the total acidity inputs need to be compared to the critical load function, rather than considering the individual components against CLmaxS and CLmaxN.
The simplified version of the CLRTAP exceedance method, presented in Section 3 can be used to calculate the deposition (PC or PEC) as a proportion of the critical load function.
The potential impacts of additional sulphur and/or nitrogen deposition from a source are partly determined by PEC, because only if PEC of nitrogen deposition is greater than CLminN will the additional nitrogen deposition from the source contribute to acidity. Consequently, if PEC is less that CLminN only the acidifying affects of sulphur from the process need to be considered:
Where PEC N Deposition < CLminN
PC as % CL function = (PC S deposition/CLmaxS)*100
Where PEC is greater than CLminN (the majority of cases), the combined inputs of sulphur and nitrogen need to be considered. In such cases, the total acidity input should be calculated as a proportion of the CLmaxN.
Where PEC N Deposition > CLminN
PC as %CL function = ((PC of S+N deposition)/CLmaxN)*100
To calculate background or PEC as %CL function the approach is simply (substitute PEC with background as necessary):
Where PEC N Deposition > CLminN
%PEC to CL function = ((PEC of S+N deposition)/CLmaxN)*100
Where PEC N Deposition < CLminN
%PEC to CL function = (PEC S deposition/CLmaxS)*100
The APIS tool performs these calculations. The user is required to define CLmaxS, CLmaxN and CLminN and background deposition (which can be obtained via the Search by Location or the Site Relevant Critical Load), and the process contribution (usually available from the application form).
5. Use of specific grid reference
When undertaking a site specific search for acidity critical loads on APIS using the Site Relevant Critical Load tool, the user is presented with summary information for sites which cover more than one 1km grid square (the resolution at which acidity critical loads are defined). In this case, APIS presents the minimum (and maximum) value of CLminN, CLmaxN and CLmaxS from any of the grid squares which the site covers. Consequently, in a minority of cases, the values are taken from different grid squares within a site with the result that CLmaxN does not equal CLminN+CLmaxS.
In these situations the CLRTAP method (and the simplified version presented above) may sometimes not actually calculate the “shortest path” to the critical load function line and therefore it could overestimate or underestimate exceedance. This issue is an artefact of how APIS generates summary information for a site, not of the critical loads function or the calculation method. It does not affect the Search by Location tool. The outcome is a possible overestimate or underestimate of the exceedance, but the method remains suitable for screening assessments. The process contribution will be compared with the lowest CLmaxN (where relevant) which is appropriate for screening purposes.
Within the Site Relevant Critical Loads tool the user can define a grid reference within the site to specify the exact location they wish to assess. This should always be done for a detailed assessment since acidity critical load and deposition can vary significantly across a site, and the potential area of impact may not be the most sensitive grid square. APIS then provides the specific CLminN, CLmaxN and CLmaxS for the grid reference specified, and the anomaly explained above does not occur.
6. References
EA R&D Technical Report P4-083(5)/1. Full ref to be added. 2003
Skeffington, R.A., Whitehead, P.G. & Abbott, J. (2006) Quantifying uncertainty in critical loads: (B) Acidity mass balance critical loads on a sensitive site. Water Air and Soil Pollution, 169, 25-46.
Skeffington, R.A., Whitehead, P.G., Heywood, E., Hall, J.R., Wadsworth, R.A. & Reynolds, B. (2007) Estimating uncertainty in terrestrial critical loads and their exceedances at four sites in the UK. Science of the Total Environment, 382, 199-213.
Heywood, E.A., Skeffington, R.A., Whitehead, P.G. & Reynolds, B. (2007) Comparison of critical load exceedance and its uncertainty based on national and site-specific data. Water Air and Soil Pollution Focus, 7, 391–397.
[1] CLmaxS also considers background non-marine chloride deposition. Non-marine chloride is assumed to be associated with hydrochloric acid deposition and is therefore acidifying (Hall et al. 1998, 2003).